Big Numbers today

Imagine there was a disease that everyone catches if they're in hospital. It's not that dangerous but because everyone has it then everyone who dies in hospital has it, it racks up a lot of deaths.

It's *******s, but there are a few people who think that normal deaths are being attributed to Covid-19 that would have happened anyway. It's rooted in the pre-existing conditions line that you tend to hear when someone dies.

There's a faint glimmer of logic about it but when you try to split logical hairs at that level it's nearly impossible to tease out the different factors.

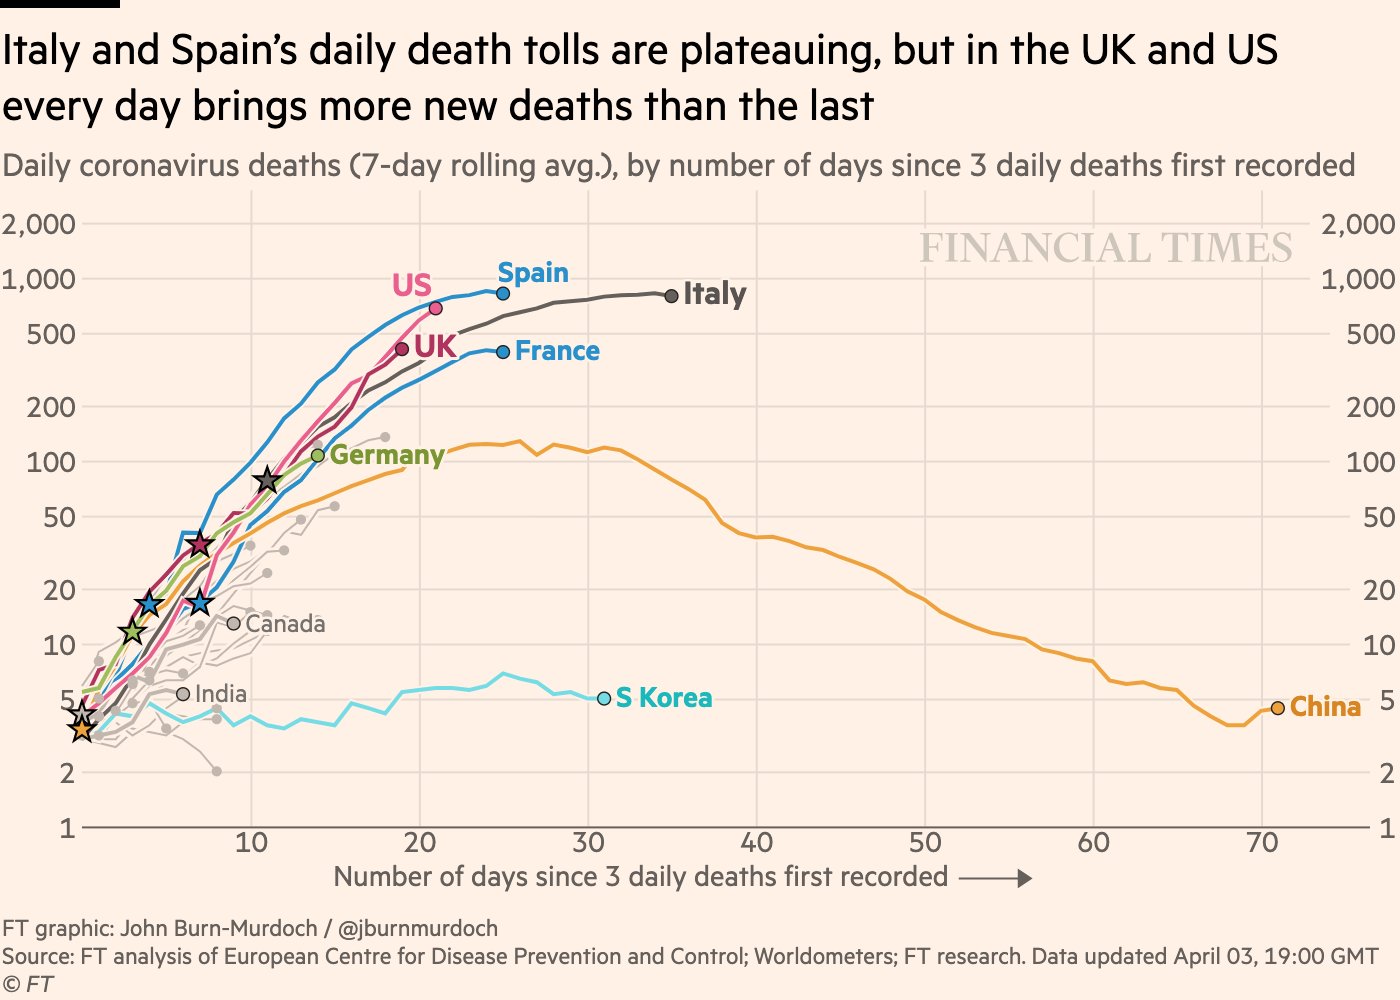
It would be interesting to see the figures showing how many die per day in normal times, and compare them to the current daily death rates, then you might see the true effect of the virus, in what are being called "excess deaths".
 
Last edited by a moderator:
Sponsored Links
It would be interesting to see the figures showing how many die per day, in normal times, and compare them to the current daily death rates, then you might see the true effect of the virus, in what are being called "excess deaths".
Won't be known for some time - the deaths being recorded are just those in hospital/been tested as far as I know. There's still people dying at home from presumably this disease.
 
The last 3 days of the PHE graph are fairly close to a straight line rather than getting steeper. Good sign providing the updates are 1 day apart. They have changed the timing but if it makes one day look low the next has always been higher than it would have been. They have said that the death rates are from what are effectively random samples so expected to vary. They too look straight line for the same days but the scale is rather small.

C4 had a doctor from critical care in Newport on. He mentioned that his patients were a lot younger than expected. 50's top and some younger. He said they had been told it would mostly effect older people. That's not what he is seeing.

:( Also watched the chat show they had on after the news. The epidemic mapping man was depressing. He's been on before. Don't know what to make of him. The economy definitely figures in his thoughts and timescales. All of the science experience seems to be based around epidemics in under developed countries. New epidemic and most countries seem to take a slow response other than the few that went a different way. Korea it seems did due to one ebola infected person leading to 300 others but they have had other similar problems as well so decided to be ready for the next one. I wonder if they were ready for the ebola actually.
 
Looking at the average deaths per day over the last 7 days, and it would show some hope that Italy is peaking. we're going up like a space rocket, although we are 10 to 14 days behind Italy, we have crossed their line. (USA line is also very worrying, but remember there population is 5x bigger)

tmp4.gif
 
Sponsored Links
Is this day zero adjusted?
yes, roughly from first fatality. However I don't believe that is important in this chart as it is simply trying to see when the peak is reached. The steepness of the line is the salient bit not whether we are in front or behind someone else. It would be nice to know there is an end in sight.
 
yes, roughly from first fatality. However I don't believe that is important in this chart as it is simply trying to see when the peak is reached. The steepness of the line is the salient bit not whether we are in front or behind someone else. It would be nice to know there is an end in sight.

It's not that easy to do. Take the UK for instance. Cases initially in population centres and then spreading across the country. Makes it difficult to take population into account and cases into hospital is a better option. Time for people to die varies as well. Figures seem to range from a couple of hours to same number of weeks.

I found the SAGE pages

https://www.gov.uk/government/group...mergencies-sage-coronavirus-covid-19-response

Also a paper that looks like a primer for politicians and other low life so not too bad for us. CV19 is like flu transmission but with bells on.

https://assets.publishing.service.g...file/756738/SPI-M_modelling_summary_final.pdf

I hoped to find some uk regional graphs.
 
I hope this is not going to happen:

US & UK both likely to pass Spain for peak daily deaths
• Daily death tolls in the thousands to become the norm in US
• UK now clearly steeper than Italy

EUtWRo7XYAIg3t1
 
It's not that easy to do. Take the UK for instance. Cases initially in population centres and then spreading across the country. Makes it difficult to take population into account and cases into hospital is a better option. Time for people to die varies as well. Figures seem to range from a couple of hours to same number of weeks.

I found the SAGE pages

https://www.gov.uk/government/group...mergencies-sage-coronavirus-covid-19-response

Also a paper that looks like a primer for politicians and other low life so not too bad for us. CV19 is like flu transmission but with bells on.

https://assets.publishing.service.g...file/756738/SPI-M_modelling_summary_final.pdf

I hoped to find some uk regional graphs.
you can easily complicate it to the point it becomes meaningless to the vast majority, just in the way your links demonstrate.

I still think it reasonable to look at it on a country level I'm using worldometer's data, it won't be highly accurate but will still be indicative as to how various governments policies are working, and how resilient that country is, government strategy is the key and hospitals within a country can more easily share resources.

From what I read the average time from first symptoms to death is around 3 weeks (one report suggesting 18.8 and another suggesting 27)?
 
The papers in the link seem to indicate an average time in hospital of 10 days. It seems to be risk assessment based. I've not seen any info on time to death only heard comments from health workers.
 
I hoped to find some uk regional graphs.

Do you mean this?
https://www.arcgis.com/apps/opsdashboard/index.html#/f94c3c90da5b4e9f9a0b19484dd4bb14

after reading this
https://www.theguardian.com/world/2...about-the-uks-coronavirus-death-toll-is-wrong
may be the numbers we are getting are quite meaningless?

Same argument across the board though. China, is carefully selecting death toll figures, while a 1/3rd of the world still has its head in the sand.
 
after reading this
https://www.theguardian.com/world/2...about-the-uks-coronavirus-death-toll-is-wrong
may be the numbers we are getting are quite meaningless?

All that link means is there is a delay after some one dies to determine why. They want precise details. They have said that they are trying to both shorten and make that time more consistent.

That explains why the gov advisors say that the deaths are a random sample. The time to death from health workers comments can range from 2hrs to 2 weeks. People who catch it are random samples so to some extent deaths are too. They have skewed the people who catch it by asking 70+ to self isolate for 3 months. Fine if some one drops in food for them but that wont be happening in all cases.

So in real terms after the hospital entry count starts falling deaths could carry on increasing for some time. Weeks/days are significant times.

The only thing that can really be said is that currently the death rate looks to be around 10% of those going into hospital. A figure that I think has cropped up before.
 
Last edited:

No the same for the health regions. I've been watching the counts rise and it's pretty clear that less populous areas have been the main cause of the increase in steepness of the curve. There are also oddities. Wales in it's entirety is a bit behind B'ham in cases per million people. Sheffield well ahead but what area does that really cover. The health region populations aren't available any more due to changes. Something National Statistics are meant to sort out. They have also started counting out of hospital deaths due to CV19 via registrations. There will be a lag in that and GP's usually fill them in and maybe no autopsy.
 
Sponsored Links
Back
Top