
I have
a column of temperatures in A
A column of resistances in B
I want a graph of A against B.
If I highlight the two columns and click the pic in the chart toolbar, I get a graph of resistances against the number of the row it's on.
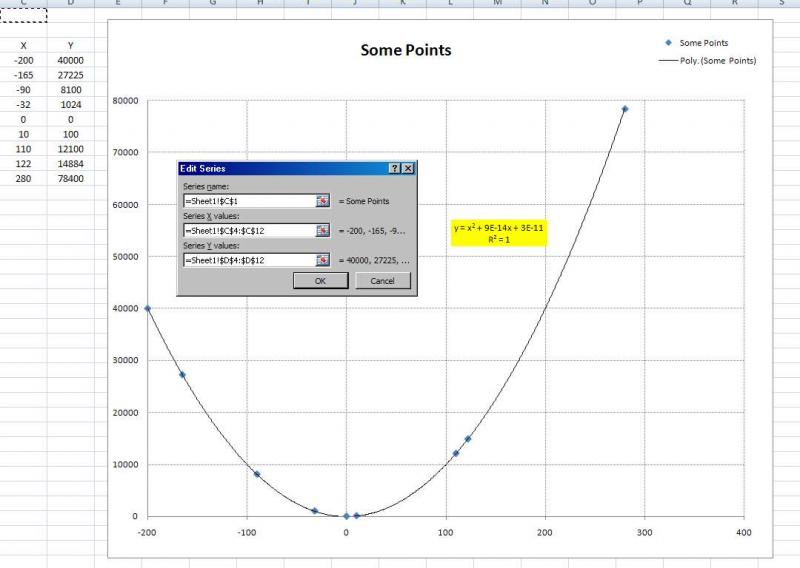
How can I make the data source for the X axis be the figures in column A?
I get this:

a column of temperatures in A
A column of resistances in B
I want a graph of A against B.
If I highlight the two columns and click the pic in the chart toolbar, I get a graph of resistances against the number of the row it's on.
How can I make the data source for the X axis be the figures in column A?
I get this: