

- Joined
- 22 Aug 2006
- Messages
- 7,844
- Reaction score
- 1,481
- Country

#Indicators
That's the term used for things which help guide.
You can use them to indicate where to buy and sell, directly. They won't always be right, but most of the time. You can combine different ones looking for "confluence" - agreement.
They're mostly based on either a Moving Average of the price, or the Volume of buys and sales, or both.
It's important to realise they're all Lagging - none of them predict the future, though some try, using a sort-of momentum idea.
You can usually access dozens on a chart. Have a play.
They can quite useful for "swing" trading/investing, where you use the fact that all prices go in waves. You should read about them, at least.
Here are two
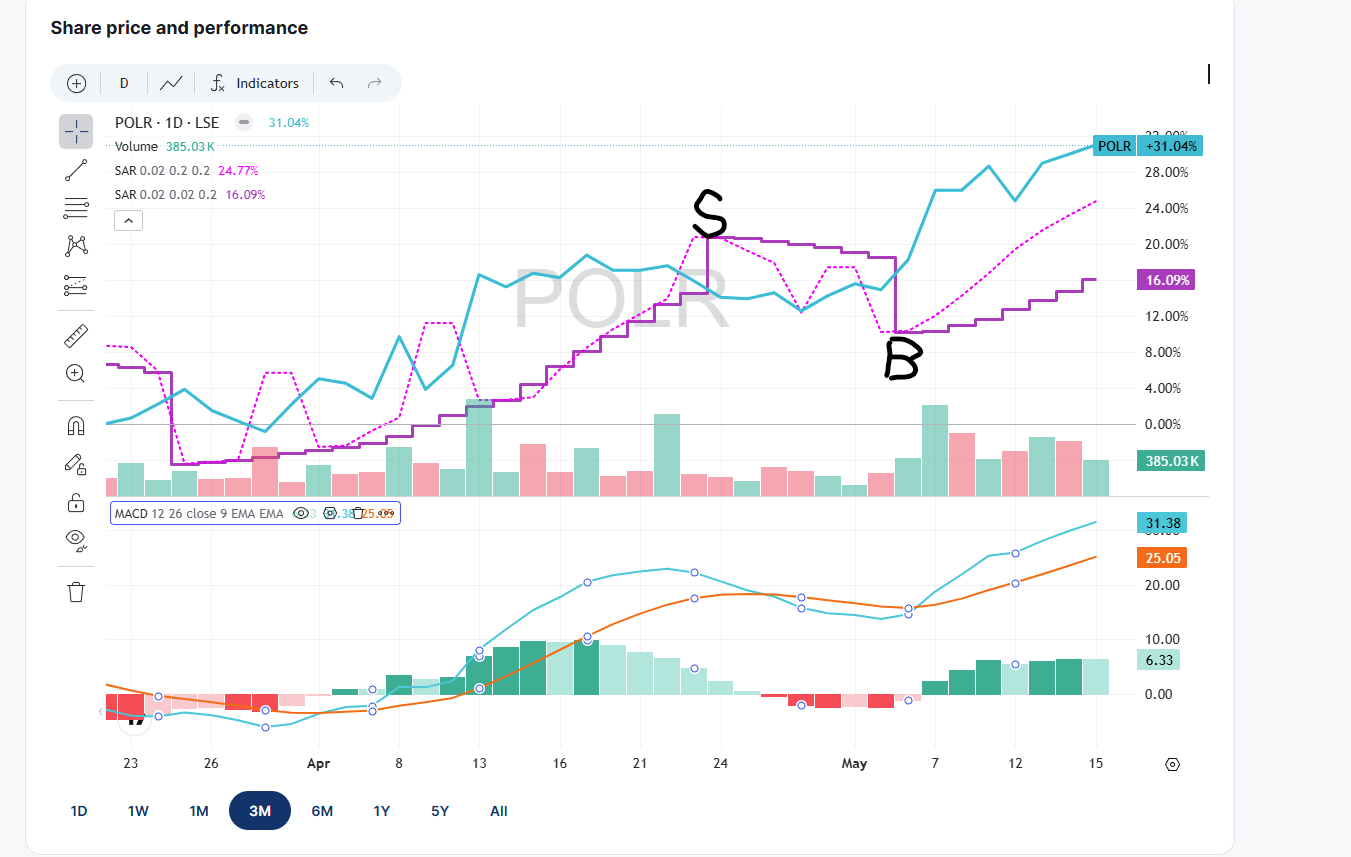
The price of the "instrument" (a name for any stock, bond, fund, etc) here is the one marked POLR for Polar Capital, it's on the London exchange.
The pink/green histogram bars are Volume. Taller is more, green is up pink down. On this scale not so useful, much moreso on very short term charts.
The steppy purple line and the pnk dashed one, are both something referred to as SAR or Parabolic SAR. You can look up all of them at Investopedia, linked from the Indicators heading.
The difference between th two is sensitivity, which you can fiddle with in their Settings ( always marked "..." ).
In this case they're timing/damping settings. As you can see, the steppy one ignores more of the wiggles. Buying and selling has a cost overhead, and timing errors, so doing it too frequently is often a mistake.
You can see where the Sell is indicated, the price is dropping. Being in cash there might save you from a big drop, so the error if any, is a sort of insurance. Notice that where The Buy is indicated, the price is actually HIGHER than where you sold, so with hindsight you would have been better just holding on.
If you look at the dashed line though, see that if you had reacted as soon as the line went FLAT, you would have got an advantage, just.
School maths - remember that the slope of the price line is the first derivative.
Like speed in a car, positive means you're making progress.
The second derivative is like acceleration/decceleration.
If you want an early sign to "get out of" (or into) an instrument, you react if the slope is starting to go flat. The speed, while still positive, is starting to reduce, like you're braking.
The rate of rise is reducing.
If you get out early, you miss some distance/ price increase, but you don't lose any money.
An Indicator which USES that idea is called MACD .
It shows where a TREND is not being conformed with by the price.
" a "divergence" is the situation where the MACD line does not conform to the price movement, e.g. a price low is not accompanied by a low of the MACD." That's what you look for, with this indicator.
If you follow say the S&P 500, it'll show that, perhaps 2,3,4 times a day. One of them might be wrong for a very short time.
On the lower part of the chart, MACD, you'd buy where the blue line goes above the red.
Again, you can change the numbers referring to the lengths of the periods it uses as moving averages. The default ones 12,26,9 are OK for swing trading, ie days to a few weeks. . For day trading or other periods, ask AI, it'll tell you how to alter them.
One reason to USE these indicators, along with some others (eg Anchored VWAP, or long term Moving Averages (50 day, for example) and those LEVELS I go on about ) is that the trading bots use them. So you buy when they buy, and the price goes up. Jolly good.
Questions?
That's the term used for things which help guide.
You can use them to indicate where to buy and sell, directly. They won't always be right, but most of the time. You can combine different ones looking for "confluence" - agreement.
They're mostly based on either a Moving Average of the price, or the Volume of buys and sales, or both.
It's important to realise they're all Lagging - none of them predict the future, though some try, using a sort-of momentum idea.
You can usually access dozens on a chart. Have a play.
They can quite useful for "swing" trading/investing, where you use the fact that all prices go in waves. You should read about them, at least.
Here are two
The price of the "instrument" (a name for any stock, bond, fund, etc) here is the one marked POLR for Polar Capital, it's on the London exchange.
The pink/green histogram bars are Volume. Taller is more, green is up pink down. On this scale not so useful, much moreso on very short term charts.
The steppy purple line and the pnk dashed one, are both something referred to as SAR or Parabolic SAR. You can look up all of them at Investopedia, linked from the Indicators heading.
The difference between th two is sensitivity, which you can fiddle with in their Settings ( always marked "..." ).
In this case they're timing/damping settings. As you can see, the steppy one ignores more of the wiggles. Buying and selling has a cost overhead, and timing errors, so doing it too frequently is often a mistake.
You can see where the Sell is indicated, the price is dropping. Being in cash there might save you from a big drop, so the error if any, is a sort of insurance. Notice that where The Buy is indicated, the price is actually HIGHER than where you sold, so with hindsight you would have been better just holding on.
If you look at the dashed line though, see that if you had reacted as soon as the line went FLAT, you would have got an advantage, just.
School maths - remember that the slope of the price line is the first derivative.
Like speed in a car, positive means you're making progress.
The second derivative is like acceleration/decceleration.
If you want an early sign to "get out of" (or into) an instrument, you react if the slope is starting to go flat. The speed, while still positive, is starting to reduce, like you're braking.
The rate of rise is reducing.
If you get out early, you miss some distance/ price increase, but you don't lose any money.
An Indicator which USES that idea is called MACD .
It shows where a TREND is not being conformed with by the price.
" a "divergence" is the situation where the MACD line does not conform to the price movement, e.g. a price low is not accompanied by a low of the MACD." That's what you look for, with this indicator.
If you follow say the S&P 500, it'll show that, perhaps 2,3,4 times a day. One of them might be wrong for a very short time.
On the lower part of the chart, MACD, you'd buy where the blue line goes above the red.
Again, you can change the numbers referring to the lengths of the periods it uses as moving averages. The default ones 12,26,9 are OK for swing trading, ie days to a few weeks. . For day trading or other periods, ask AI, it'll tell you how to alter them.
One reason to USE these indicators, along with some others (eg Anchored VWAP, or long term Moving Averages (50 day, for example) and those LEVELS I go on about ) is that the trading bots use them. So you buy when they buy, and the price goes up. Jolly good.
Questions?
Last edited:
 . I am "overweight" in those.

