Can I have a 10% Tax rate as well please?

I'm not aware that the UK has enacted such a law. But this is not something I am attempting to follow.

Buffoon Johnson claims that he will make UK leave the EU by 31st December 2019.

This may be a coincidence.

Countries that are in the EU have to implement the anti-tax avoidance directive in their national law by 1 January 2020.

It includes rules to tackle hybrid mismatches with the tax systems of countries outside the EU.

https://www.consilium.europa.eu/en/policies/anti-tax-avoidance-package/

But the UK Laws already exceed those laws, which aren't aimed at individuals anyway. So what laws?
 
Sponsored Links
https://www.theguardian.com/busines...st-people-exploiting-loophole-to-cut-tax-rate

HMRC data shows 9,000 people paid just £5.1bn in tax on £33.7bn of capital gains income in the latest financial year available. That works out at an average tax rate of 14.8%, lower than than the basic rate income tax of 20% that people pay on salaries of between £12,501 and £50,000.

https://www.theguardian.com/politic...ed-by-britains-richest-urges-former-hmrc-head

The former head of HM Revenue and Customs has called on the government to scrap a controversial tax break designed to help entrepreneurs, which he said was costing the country £2bn a year in lost tax yet provided “no incentive for real entrepreneurship”.

“It gives £2bn CGT savings every year to those who have already made their gains and provides no incentive for real entrepreneurship.”

I don't see the usual lot on here talk about this giveaway?


No one likes to pay more Tax than they should but I am a higher rate tax payer, fair enough I earn more so I pay more. I would like those earning millions to pay the same or similar proportion that I do.

Now who disagrees with that?
Would you not feel more at home in an economics debating forum...or whatever your degree is in...instead of being on here calling people thick?...Or is it the truth that amongst your peers,you are shunned by them for not being very bright and you feel more at home and important trying to lord it over a bunch of tradesmen you can feel superior to?..
 
Filly hates the fact that the Tories make it their policy and are well accustomed to driving those least well off into austerity. He'll spout anything in order to deflect.
maybe there wasn't any money left.

Austerity and ultra low interest rates hit the rich way more than the avg person.
 
Sponsored Links
maybe there wasn't any money left
Irrelevant. All governments borrow.

Austerity and ultra low interest rates hit the rich way more than the avg person.
Those in poverty, i.e. those that suffer the most due to Tory penny pinching, are not average.

'The rich' will have to make do with brandy instead of Cognac.:rolleyes:
 
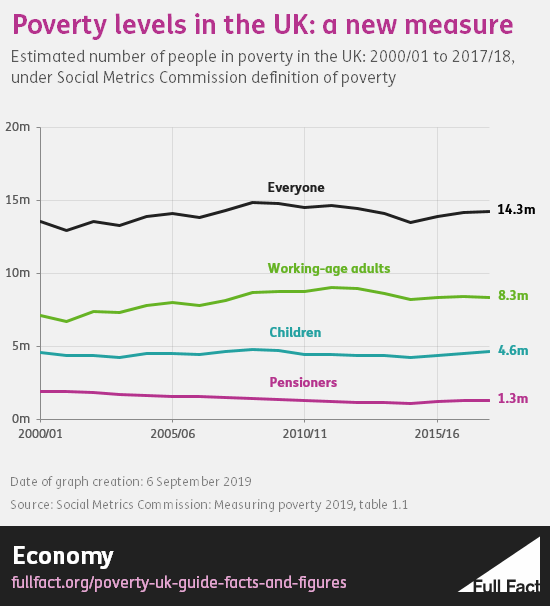
maybe you missed the info in the above :
SMC_levels.png


Its lower on all counts that it was under the last labour government.
 
Filly hates the fact that the Tories make it their policy and are well accustomed to driving those least well off into austerity. He'll spout anything in order to deflect.
I used noseall off that list of silly x etc..

'Silly noseall makes silly denigrating comments to anyone he doesn't understand or like. He will say anything or edit any comment to make him sound
maybe you missed the info in the above :
SMC_levels.png


Its lower on all counts that it was under the last labour government.
Oh here we go more tory lies..no wait I can see that micro small pixel along the black line just when Tories took over that must be that persons Toe nose'f'all must be talking about. :eek:

Well that graph certainly explains alot doesn't it..yes people peddling more bs on here thanks for the post motorbiking.
 
Its lower on all counts that it was under the last labour government.

Is it?

Unfortunately that's not clear from your graph.

I can see the pensioners' line declining almost continually since at least 2000 (Labour were last in power 1997 to 2010), which looks like good news.

Your graph looks like the "everyone" line has been increasing for the last five years or so, but the graph is too imprecise to see what's happening.

As Fullfacts says, "The most marked reduction has been in pensioner poverty, it is almost half as common as it was back in 2000, while rates for working-age adults are now slightly higher"

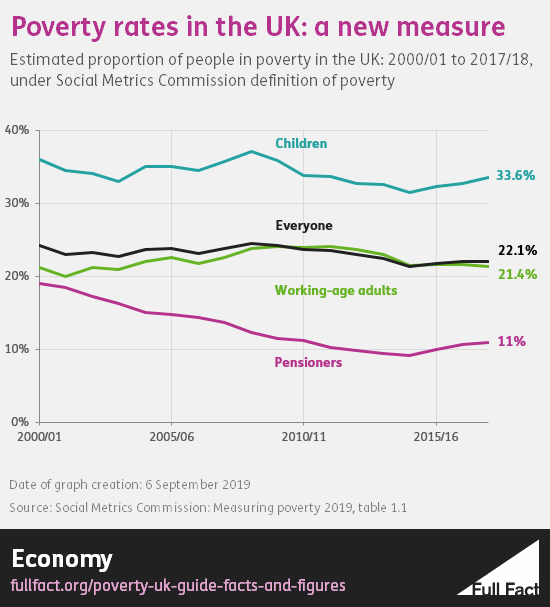
If we look at the percentage rates of poverty, the graph in recent years is not as glowing as the one you chose. Do you ascribe changes in poverty to government policies? Clearly you do, since you draw attention to changes since the tories took over.

SMC_rates.png

Define poverty?
 
Well using those figures from full fact the Government changed the way it measures poverty. I wonder why..

There is no official measure of poverty and this new measure was introduced in 2015 when the effects of Austerity were coming throgh so they moved the goalposts.

Now is this measure better or worse than the one before? Well it takes in some assets and uses a three year rolling average to it evens out troughs and peaks and smooths the lines.

So looking at those graphs if you say Labour increased welfare payments it had no effect on child poverty but cutting and restricting payments did under Tories. (y):LOL:
 
click the links in the article the references are all there. poverty is not worse under the 2010, 2015, 2017 tory government contrary to opinion. I'm not saying Labour policy made people in poverty worse off. I'm challenging the view that Tory policy has.
https://socialmetricscommission.org.../SMC_measuring-poverty-201908_full-report.pdf

Page 20 says it all. As does the ES on 5 and 6.

KEY MESSAGES:

Based on the Commission’s approach to measuring poverty, this report shows that:

  • ƒ There are 14.3 million people in poverty in the UK. This includes 8.3 million working-age adults; 4.6 million children; and 1.3 million pension-age adults.

  • ƒ This means that, despite fluctuations, overall rates of poverty have changed relatively little since the millennium. The current rate of poverty is 22%, which is the same as last year and only slightly lower than the 24% seen in 2000/01 (the first available year of results using the Commission’s approach).

  • ƒ However, this trend hides significant changes in rates of poverty among different groups. Poverty rates amongst pension-age adults fell steadily from 19% in 2000/01 to 9% in 2014/15 but have since risen slightly to 11%. Similarly, poverty rates among children dropped from 36% in 2000/01 to 31% in 2014/15, but have now risen slightly to 34%.
 
Last edited:
Page 20 says it all

After a long trend of improvement, things took a turn for the worse at 2014/5, especially for pensioners and children.

In what way does this challenge criticism of the Con government?
 
Sponsored Links
Back
Top