
You are using an out of date browser. It may not display this or other websites correctly.
You should upgrade or use an alternative browser.
You should upgrade or use an alternative browser.
Gas Boiler Heat Exchanger Pressure Loss
- Thread starter Johntheo5
- Start date

They're showing the whole boiler head loss not just the heat exchanger head loss.
Is that an old measurement of pressure? How does it convert?Water gauge
Is this just a pump curve so??They're showing the whole boiler head loss not just the heat exchanger head loss.
1 inch = 25.4MM= 0.0254MIs that an old measurement of pressure? How does it convert?
Thanks. Didn't know what the units were.1 inch = 25.4MM= 0.0254M
My boiler looks like 27 inches on the dotted line, which is about 0.7 metres. That's less than 20% of the Vaillant at similar flow rate. Is that because a cast iron boiler has less resistance?
Just convert inches to meters (divide by 40 near enough) and you're there.Is that an old measurement of pressure? How does it convert?
Compare the sectional view of the Gianonni exchanger as opposed to a large waterway high mass cast exchanger; small bore, manifolds, duplicated tubes equate to high head loss.
No problem as long as you can achieve the mass flow rate you need and maintain the minimum flow rate while still overcoming resistance around the index circuit. If not then a low loss header or some other arrangement with a second pump will be needed.
No problem as long as you can achieve the mass flow rate you need and maintain the minimum flow rate while still overcoming resistance around the index circuit. If not then a low loss header or some other arrangement with a second pump will be needed.
You need the total boiler headloss (not just the h/ex, though that will be the bulk of it). Estimate the loss in the rest of the system, also varies as flow squared. At each flow, add the 2 losses to get a total system curve. Of course, there is zero static head in a CH system. Plot that on the pump curve and where they intersect is the flow and head.Is this just a pump curve so??
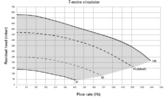
I must admit I can't see what your 2nd, pump graph, is telling us. A pump characteristic is usually a single curve sloping down from left to right, sometimes with a hump in the middle. Perhaps a family of curves at a range of speeds.
Is this just a pump curve so??
It shows the residual head
Attachments
You need the total boiler headloss (not just the h/ex, though that will be the bulk of it). Estimate the loss in the rest of the system, also varies as flow squared. At each flow, add the 2 losses to get a total system curve. Of course, there is zero static head in a CH system. Plot that on the pump curve and where they intersect is the flow and head.
I must admit I can't see what your 2nd, pump graph, is telling us. A pump characteristic is usually a single curve sloping down from left to right, sometimes with a hump in the middle. Perhaps a family of curves at a range of speeds.
Viessmann have another graph I find confusing, but not quite as bad, and maybe it might help make sense of the Vaillant one. Maybe it's a German thing. It also has a horizontal line across it, like the Vaillant one. Viessmann call it Upper Operational Limit, and I have no idea what it means.
Last edited:
DIYnot Local
Staff member
If you need to find a tradesperson to get your job done, please try our local search below, or if you are doing it yourself you can find suppliers local to you.
Select the supplier or trade you require, enter your location to begin your search.
Please select a service and enter a location to continue...
Are you a trade or supplier? You can create your listing free at DIYnot Local
Similar threads
- Replies
- 2
- Views
- 2K