- Joined
- 22 Jan 2007
- Messages
- 24,052
- Reaction score
- 3,558
- Country


As you must be aware, there is a large amount of literature 'out there' with a whole spectrum of differing conclusions. However, that does not alter my intuitive feeling that they have to be 'better than nothing'. Also, in addition to whatever direct effect they have, they probably also serve a 'psychological' benefit, in reminding people that things are not 'normal', and that we need to remain cautious about our degree of contact with other people.Can you provide any citations for this, beyond the mannequin / droplet studies? (Flawed by the way since it is aerosols which count).
Thanks Denso. I've not read all of it yet, but I wonder which particular parts of this you find most compelling, and which studies referred to provide the best evidence?This one is a good read, https://www.pnas.org/content/118/4/e2014564118
I'm not quite sure what you are saying.The 'exponential' word is cropping up far more than the actual data permits. ... The rising part of these curves is never exponential. The falling part is.
Thanks Denso.
It is, as I said, a messy situation, with little convincing evidence in any direction, presumably at least partially because of the difficulty in studying the question - to get a truly decisive answer would probably require some 'unethical' studies!Thanks Denso. I've not read all of it yet, but I wonder which particular parts of this you find most compelling, and which studies referred to provide the best evidence? I'm struggling to find conclusive stuff among the studies reported. No shortage of "suggest", "could" and "may".
You are surely not suggesting that the rapid falls in cases which followed soon after our implementation of lockdowns (in March, November and early January) were 'co-coincidences', or even the result of seasonal factors, are you?
They will, but obviously more frequently in populations/countries with a high prevalence of infection. As I said, variants can only arise during replication in infected people, so, the more infected people there are .... !!
I'm no virologist, so I can't comment on that but, on the basis of what I do know, I don't see. mechanistically, why that necessarily has to be be the case
That would be true if the variant itself was relatively 'benign' (as well as having 'vaccine escape') but, as above, I don't know how confident we can be that such will necessarily be the case. Them main 'variants of concern' we have so far seen all seem to exhibit some degree of 'vaccine escape', but have tended to be more, rather than less, infectious.
That is, of course, one of the main arguments being presented for 'now' - I just hope that it proves to be a prudent approach - although, as you will realise, I have my uncertainties about that.
Kind Regards, John
It is, as I said, a messy situation, with little convincing evidence in any direction
I'm not quite sure what you are saying.
On a theoretical basis (assuming that each infected person infects an average of N others - the 'R' value), the rise (when R>1) should be exponential and the fall (when R<1) should be negative exponential.
No need for theoretical bases and R0 when we have real data, and you'll find that it's impossible to fit an exponential to the rising parts of the curves.
This means that R0 is not a reliable predictor, because it does not remain constant.
Everyone cites Sweden, and I don't think anyone has much of a clear understanding of what happened there, and why (do you?) - there was a rapid, apparently 'spontaneous' fall about 7-8 months after an equally rapid rise. Can you cite any country other than Sweden where there was a marked fall in the absence of appreciable 'control measures?Yes I am. You'll see exactly the same curve in Sweden, which did not lockdown. It's just what happens.
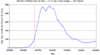
Well, for a start, back then we had no idea as to how many cases there were, since we were essentially only testing (hence counting) those ill enough to be in hospital, hence vastly underestimating the true number of cases. However, in terms of the numbers we do have, I really don't understand your suggestion that infections peaked prior to lockdown (vertical rewd line indicates lockdown.Since you've done a good deal of analysis, you will have noticed that the infection rate in March 2020 had already peaked before lockdown.
R0 is, in itself, of no relevance, since that is the 'reproduction (transmission) rate' in a totally free-ly mixing population (no 'control measures') which is totally susceptible )i.e. no-one with any immunity). What matters is the prevailing R, which is influenced by both the control measures and the degree of population immunity.No need for theoretical bases and R0 when we have real data ...
I've already agreed with that, as far as the UK is concerned. The early parts of the rises and the late parts of the falls have been essentially exponential, but the best fit to the (important) bit in-between has been essentially linear (both up and down). I don't think anyone yet fully understands this, but it has presented on of the headaches for modellers.... and you'll find that it's impossible to fit an exponential to the rising parts of the curves.
Quite, as above, it's 'R' (which varies) which matters, not R0. However, that does not really help us to understand the shape of the curves we've seen in the UK, since, for example, the near-linear parts of the rising curves imply a progressively (but unexplained) reduction in R. .This means that R0 is not a reliable predictor, because it does not remain constant.
Interesting. Worldometer data that I was plotting at the time showed a clear peak in the rate of increase on or around 18 March.I really don't understand your suggestion that infections peaked prior to lockdown (vertical rewd line indicates lockdown.
If you need to find a tradesperson to get your job done, please try our local search below, or if you are doing it yourself you can find suppliers local to you.
Select the supplier or trade you require, enter your location to begin your search.
Are you a trade or supplier? You can create your listing free at DIYnot Local