
You are using an out of date browser. It may not display this or other websites correctly.
You should upgrade or use an alternative browser.
You should upgrade or use an alternative browser.
How long for the Fuse to trip
- Thread starter bigalert
- Start date
4 hours at a guess
This page
http://www.tlc-direct.co.uk/Figures/Graphs.htm
links to this graph
So looks like even a pretty long shower would be OK.
http://www.tlc-direct.co.uk/Figures/Graphs.htm
links to this graph
So looks like even a pretty long shower would be OK.
- Joined
- 27 Jan 2008
- Messages
- 28,907
- Reaction score
- 3,537
- Location
- Llanfair Caereinion, Nr Welshpool
- Country

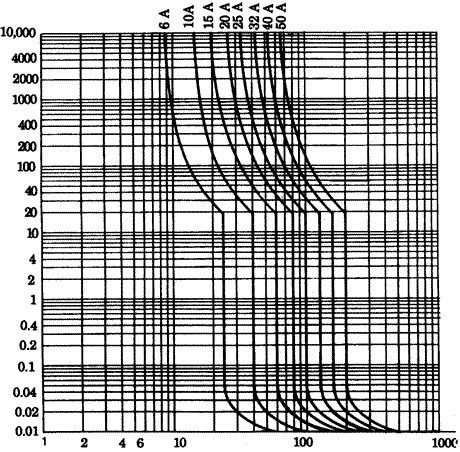
At 1000 seconds where the chart shows 32A trace crossing 40A line so around 1/4 hour. However there is no exact figure and the more often it reaches the trip point the weaker it will get so over time the delay will gradually reduce.
Type 1, 2, 3, 4 or B, C, D will have no effect on this time. But temperature in the enclosure will so the figure will vary and one may find it will trip within 5 mins when other power consumption has pre-warmed the enclosure.
Type 1, 2, 3, 4 or B, C, D will have no effect on this time. But temperature in the enclosure will so the figure will vary and one may find it will trip within 5 mins when other power consumption has pre-warmed the enclosure.
Need some help please.If a type 1 32a mcb is protecting the circuit supplying a 9.5kw shower, how long would the fuse ???? last before the current draw made it trip.
Excuse me for asking , but why do you ask this question ?
Or even 10,000 seconds, 2 3/4 hours.At 1000 seconds where the chart shows 32A trace crossing 40A line so around 1/4 hour.
Someone has said they had uprated their shower from a 7.5kw to 9.5kw and after a while showering the fuse trips . They said they were going to uprate it to a 40amp fuse. Having referred to the chart at TLC i told them the circuit needs checking as a 9.5kw shouldn't overload a 32amp breaker or at least not that quickly.
Wanted to check my interpretation of the graph was right.
Will talk to them again tomorrow.
Wanted to check my interpretation of the graph was right.
Will talk to them again tomorrow.
I suppose that in addition to what ericmark has said above..
I don't know what the BS says, but these lines on these types of graphs don't neccessarily mean all devices being measured will work exactly as shown.
It might mean 50% will trip above the line, 50% below. Then we need to know the distribution, is it normal? What is the standard deviation?
If you are making, for example, an aircraft wing, and this was measuring performance, the graphs might be very very accurate for all such wings. For a £5 CB, there might be quite a wide tolerance allowed in the BS. Dunno.
And looking at the graph, I don't actually think the line touches the 40amp value. Of course we don't know what happens outside the range of the graph, and are probably not qualified to judge, but it doesn't appear to touch, ever.....
You put that right. Ib ≤ In ≤ Iz.If a type 1 32a mcb is protecting the circuit supplying a 9.5kw shower.
I can't see the 32A curve crossing the 40A line anywhere....At 1000 seconds where the chart shows 32A trace crossing 40A line.
DIYnot Local
Staff member
If you need to find a tradesperson to get your job done, please try our local search below, or if you are doing it yourself you can find suppliers local to you.
Select the supplier or trade you require, enter your location to begin your search.
Please select a service and enter a location to continue...
Are you a trade or supplier? You can create your listing free at DIYnot Local