
So is not the area under a sine curve from 0° to 180° not equal to (Peak x Duration) ÷ √2 ?Missed this one last night ... the area under (or definite integral of) any voltage-time curve between two points in time will surely give you a measure of the mean voltage during that period multiplied by the duration of the period? Hence, if you divide thatarea by the durationof the period, you will get the mean voltage over that period. That statement obviously needs a little 'pedantic tweaking' if the curve has both positive and negative parts, but it is true, say, for one positive half-cycle of a sine wave.

You are using an out of date browser. It may not display this or other websites correctly.
You should upgrade or use an alternative browser.
You should upgrade or use an alternative browser.
Strip lights go out when I turn on the saw
- Thread starter Nozzle
- Start date
No.So is not the area under a sine curve from 0° to 180° not equal to (Peak x Duration) ÷ √2 ?
It's (Peak x Duration) ÷ π/2 ... which, as I said, will give you mean (i.e. peak * 2/π
") , not RMS.
, not RMS.Kind Regards, John
I don't think finding the RMS or Mean is as straight forwards as finding the area under the curve, it can be calculated using integration but needs plugged into a formulae (the bit using trig identities batters my braincell!).
The RMS = peak x 1/root2 and Mean = peak x 2/pi are nice shortcuts for engineers.
(edit - image fixed)
The RMS = peak x 1/root2 and Mean = peak x 2/pi are nice shortcuts for engineers.
(edit - image fixed)
Ah - my mistake - I thought it was.No.
It's (Peak x Duration) ÷ π/2 ... which, as I said, will give you mean (i.e. peak * 2/π
My suggestion about using a 'scope didn't need one with a log axis - any old analogue one with a grid overlay would do - my (mistaken) idea that a visual estimate of the area under the curve would be close enough to RMS for the original purpose.
They aren't "shortcuts" - they are what the formulae deliver for a sine curve.The RMS = peak x 1/root2 and Mean = peak x 2/pi are nice shortcuts for engineers.
You're actually making it sound much more complicated than it actually is:I don't think finding the RMS or Mean is as straight forwards as finding the area under the curve, it can be calculated using integration but needs plugged into a formulae (the bit using trig identities batters my braincell!).
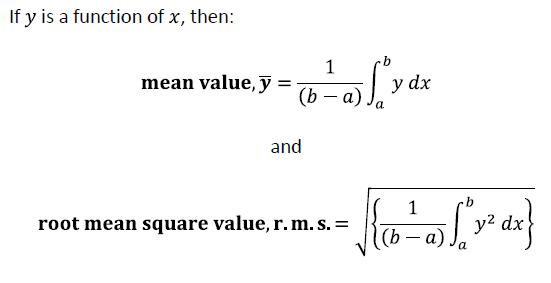
1...The mean of a voltage (any waveform, but for the time being assume it's always positive) over any period of time (say, from time a to time b) is equal to the area under the curve between those two points in time divided by the time interval between those two points (i.e. b-a). In your formula above, the integral gives the area under the curve between time a and time b, and that is divided by (b-a) [ well, multiplied by 1/(b-a), which is the same thing] to give the mean.
2...The RMS of any voltage is derived in exactly the same way, but using the curve of V² against time instead of V against time (to give 'Mean Square') and then taking the square root to get Root Mean Square. Again, the integral in your forumula is the area under the V² curve from time a to time b, that's then divided by the time interval (b-a) to get Mean Square, then the square root is taken to get RMS.
...so both mean and RMS are 'almost' as simple as the Areas under the Curves (the curves of V and V² respectively against time), the only required maths being to divide that area by the duration over which that area was measured (and, in the case of RMS, then take the square root)
As you've been told, those are not short-cuts - they are what the integrals (i.e. areas under the curve) actually work out as, exactly, for a sine wave, over any whole numbers of quarter cycles.The RMS = peak x 1/root2 and Mean = peak x 2/pi are nice shortcuts for engineers.
Kind Regards, John
Indeed so - provided only that you are looking over a whole number of quarter cycles. If you look at other time periods within a cycle, there is obviously the potential to get any answer between zero and V(peak) for both mean and RMS.They aren't "shortcuts" - they are what the formulae deliver for a sine curve.The RMS = peak x 1/root2 and Mean = peak x 2/pi are nice shortcuts for engineers.
Kind Regards, John
I actually manipulated the expression a bit to make it consistent with the way you had expressed your (incorrect) version, and that actually made it look/sound a lot more complicated than it is. ... If one works in radians, the area under a sine wave between 0° and 180° (i.e. 0 and π radians) actually works out simply as 2*V(peak). To get the mean, you just divide that area/integral by the interval (i.e. π radians), giving the mean as (2/πAh - my mistake - I thought it was.No. It's (Peak x Duration) ÷ π/2 ... which, as I said, will give you mean (i.e. peak * 2/π
*V(peak) - which is, of course, the figure we are familiar with. True - that's a functional equivalent of one with a log scale!My suggestion about using a 'scope didn't need one with a log axis - any old analogue one with a grid overlay would do ...
I guess it depends upon how close you want to be. As I've said, if you visually assess the area under a half cycle (or quarter cycle,if you want) of a sinewave and divide that by the duration of that half cycle, you'll get mean voltage. IF it's a true sine wave, at about 0.637*V(peak), that's not all that far off RMS [0.707*V(peak)]. However, the catch obviously is that if it is not a sine wave, mean and RMS could be much further apart. However, you could then use your 'log overlay' to estimate the area under the V² curve, and use that to get a true estimate of RMS (for any waveform) if you wanted.- my (mistaken) idea that a visual estimate of the area under the curve would be close enough to RMS for the original purpose.
Of course, we now have meters and scopes that actually do the integration under the V² curve 'numerically' ('digitally'), and hence calculate true RMS for any waveform - but the principle is exactly the same as your scope, 'log overlay' and eyes (and a division and square root calculation).
Kind Regards, John
Sort of - it's actually 2 times the peak voltage - see my post to BAS which follows yours - but that is, of course, only for a sine wave. This all started because BAS had an interest in estimating RMS using a scope for waveforms which were not sinewaves - in which case one obviously has to determine that area (or integral), which won't be 2*V(pk)for non-sinewaves.Not quite sure why you refer to area under the curve, from what I remember with an amplitude of 1 the area under a sine wave from 0 to 180 ° is 2 square units.
[In case anyone is interested, the derivation of the '2 units' area under a sine wave between 0° and 180° (0 and π radians) requires only very simple calculus. One can express the voltage (i.e. curve) as V(peak)*sinX, where X indicates the point in the cycle (in degrees or radians). Integrating that simply gives V(peak)*cos X, so for the interval from 0° to 180°, the definite integral evaluates as V(peak)*(cos(0°) - cos(180°)) = V(peak)*(1 -(-1)) = 2*Vpeak.]
Kind Regards, John
Indeed. Those equations are totally general. If you can express your waveform as a function of time, then you just integrate it (and integrate 'it squared' for RMS), just as one would integrate the sine expression for a sinewave. However, again, BAS's interests were in empirical, probably discontinuous, waveforms (such as come out of a dimmer), for which one wouldn't have a mathematical function/expression (and, indeed, for which an integratable function may well not exist) - hence the interest in numerical/'visual'/empirical ways of estimating the area under the V and V² curves, as a means of estimating mean and RMS.I think you can use the formulaes I referred to above to calculate for non sine waves, you just need to plug the relevant equation into it.
Very true - sorry, typed in haste - but, as you say, I got the right answersinX integrates to -cosX but your answer is correct!
")
Cheers, John
Yes, you could in that case. However, as I keep saying, this whole spin-off discussion has resulted from BAS's general (and incorrect) comment that the area under a V/time curve was a measure of the RMS value, regardless of waveform. I agree, and have agreed, that if one can express the waveform in a mathematically integratable form, then one can calculate the RMS as you describe - but if one only has an empirical waveform, one obviously cannot do that.For a clipped sine wave you could use the integration method setting the upper limit down a bit, for example instead of 0 and pi, use 0 and 9/10pi for a 10% clip off the half sine waveform.
Whatever, the point (which I think BAS now accepts) remains, that BAS's original assertion will never be correct - except, of course, for those waveforms (like a square wave) for which RMS and mean are the same. On the other hand the area under the V²/time curve always will be a measure of the the Mean Square voltage of that waveform (over the period considered), regardless of waveform (hence RMS if one takes the square root of it). Whether one can calculate (rather than determine numerically/'visually') that AUC depends on whether one has a mathematical function for V which one can square and then integrate.
Kind Regards, John
DIYnot Local
Staff member
If you need to find a tradesperson to get your job done, please try our local search below, or if you are doing it yourself you can find suppliers local to you.
Select the supplier or trade you require, enter your location to begin your search.
Please select a service and enter a location to continue...
Are you a trade or supplier? You can create your listing free at DIYnot Local