That doctor in the covid ward on the news last night.

This doesn't look like 3 jabs is good unless i have read this wrong, i am no statistical expert but for 50 59 onwards third dose patients are higher than unvaccinated, can someone explain?

Perhaps it has something to do with the age groups that were given the 3 dose earlier. Anyway there still will be an age relationship. Plus of course there are way way more vaccinated people in that age group. The percentages are usually in the same report.

Some respects irrelevant anyway. The important aspect is levels of infection in the population against hospital entries - has it changed since people have been vaccinated. Some on here might argue that it was down to the fact that the phase of the moon was getting nearer and nearer to full. Most are more sensible.

Effectiveness can be measured in 2 ways. One is protection against symptomatic infections and the other is prevention of death when infections are symptomatic,. The other way is to look at the amount of use of the 3 phases of covid treatment. Oxygen and drugs, ventilation and invasive ventilation.
 
Sponsored Links
Well my calcs from the data showed
May I respectfully suggest you give up with your calculations?

Third dose vaccinated 490 = 0.007% of the total vaccinated 50-59 year olds with 3 Jabs
I make that 100% of third dose vaccinated of the total vaccinated 3 jabs.

Unvaccinated 525 = 0.038% of total unvaccinated 50-59 year olds
Unvaccinated are 100% of unvaccinated!

So less than .5 a percent of people unvaccinated are in hospital. Which is still pretty low. Anyone care to use those stats to work out the probability ?
There is no way your calculations could possibly indicate anything of the sort.
 
Well my calcs from the data showed

Third dose vaccinated 490 = 0.007% of the total vaccinated 50-59 year olds with 3 Jabs
Unvaccinated 525 = 0.038% of total unvaccinated 50-59 year olds

So less than .5 a percent of people unvaccinated are in hospital. Which is still pretty low. Anyone care to use those stats to work out the probability ?
Being in a small minority of data doesn't change your risk of catching it. Thats known as incompatible data sets (i.e. one is much larger than the other).
start by working out the chances of catching covid. just over 1/2 a %.
Then of those that do the %age needing hospital about <10%?
Normalise the % of the group you fit in and you are about 5 - 10 times more likely to need hospital without up to date jabs.

Or to simplify, the risk of having an accident on bicycle on the motorway is incredibly low. Not because its safe to ride a bike on the motorway, but because hardly anyone does it. If you did, you'd probably last 10 minutes ?
 
There is more - the iCU and HDU levels have remained low and you can guess what state the majority of people in there are - unvaccinated. A popular age group for needing that has been 45 to 55.

The downside is that the vaccines are less effective against Omicron. There is also an Omicron mutation on the go. Said to be increasingly but just a subtype.
 
Sponsored Links
May I respectfully suggest you give up with your calculations?


I make that 100% of third dose vaccinated of the total vaccinated 3 jabs.


Unvaccinated are 100% of unvaccinated!


There is no way your calculations could possibly indicate anything of the sort.

Oh dear somebody has their knickers in a twist :D its just stats and figures they are correct i assure you i was merely attempting to quantify and not use anything for any argument here chill.
 
Oh dear somebody has their knickers in a twist :D its just stats and figures they are correct i assure you i was merely attempting to quantify and not use anything for any argument here chill.
No worries, you just need to work harder with your stats and figures.
Let me help you out:
Third dose vaccinated 490 = 0.007% of the total vaccinated 50-59 year olds with 3 Jabs

You see how both the '490' and the 'total vaccinated 50-59 year olds with 3 jabs' both describe exactly the same. Therefore one must be 100% of the other.

You repeated the same scenario with your second 'calculation'. It doesn't make sense:

Unvaccinated 525 = 0.038% of total unvaccinated 50-59 year olds

Therefore your calculation couldn't possibly suggest what you claimed it did:
So less than .5 a percent of people unvaccinated are in hospital. Which is still pretty low. Anyone care to use those stats to work out the probability ?
 
its not just about covid deaths, long covid is a serious problem

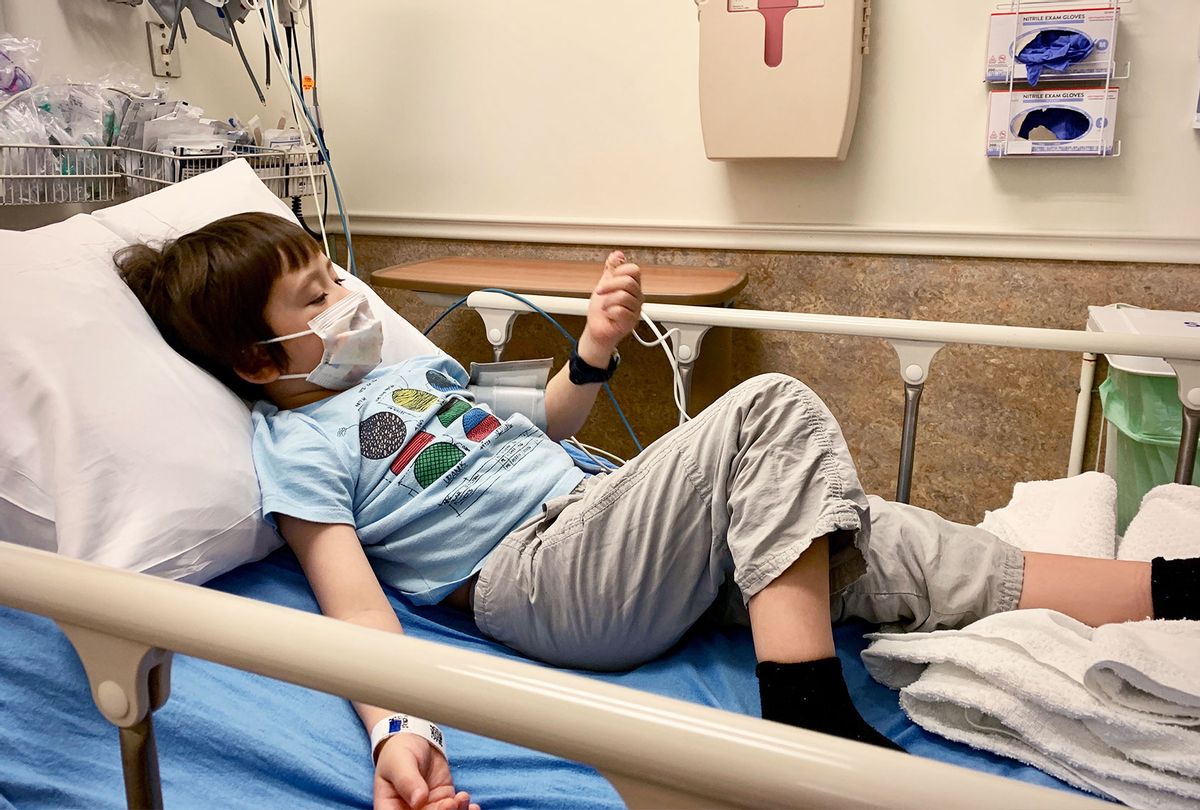
The kids are not alright: Data suggests 10% of children with COVID-19 become "long-haulers"

Doctors around the world estimate one in ten children with COVID-19 have long-term side effects

sick-child-covid-bed-hospital-0121221.jpg

https://www.salon.com/2022/01/22/th...s-10-of-children-with-19-become-long-haulers/

 
There was a comment on children and covid recently. A number in hospital for other reasons with covid. That would add to handling them problems, Nurseries have also reported problems even claiming looking after kids whose parents are infected.

The main info on ICU and HDU entries is the SARI watch which usually just monitors flu. It's been running at ~0.6 /100,000 population since week 30 last year. In week 3 it was about 2.4, falling to low numbers by week 10 then rising to current numbers from week 25 to 30. There is also an age breakdown.

ICUHDUageWeek3.jpg


The fact that 85 year olds are making to there is interesting. Survival rates when there pass. HDU was ~50%. They did split the 2 areas in the past.
 
May as well add deaths too. Week 3 ~8000 falling much as SARI figures then steadying at ~1100 / week by week 32 then a rise from week 51 to week 2 to ~1300 per week.
 
No worries, you just need to work harder with your stats and figures.
Let me help you out:

You see how both the '490' and the 'total vaccinated 50-59 year olds with 3 jabs' both describe exactly the same. Therefore one must be 100% of the other.

You repeated the same scenario with your second 'calculation'. It doesn't make sense:


Therefore your calculation couldn't possibly suggest what you claimed it did:

Ive seen you argue with many people on here always from same point of being unquestionably correct. You missed the formulae i used to produce these percentages. Im not wasting my spare time on a bigoted fool explaining.
 
No it really isn't. The figures compare well with other diseases when you compare "died with no comorbidities" to the alternative.

How many people died of pneumonia alone with no comorbidities? Would you expect it to be much lower than the alternative?

The point is that covid, like any other virus, is most dangerous to the very old and the sick and relatively harmless to the young and healthy, i.e. most of the population - therefore we should not have had universal restrictions. Resources should have been concentrated on the most susceptible.

Perhaps the most revealing figure is overall deaths, which have not been much higher than in recent years, and in fact have been lower than some "bad flu years".

Also proving covid's harmlessness are the politicians, scientists and modellers who ignored their own rules to go to parties, have affairs, visit distant relatives etc.

...and you won't get "pneumonia alone with no comorbidities"; pneumonia is a natural bodily reaction to to some other infection, virus, injury etc.
 
Last edited by a moderator:
Sponsored Links
Back
Top